Our relationship with water is conflicted. We are all born in water, our bodies are mostly water, and every other living element on this earth depends on water, and yet we manage water as just a resource and commodity. The Great Lakes bioregion is gifted with 20% of the world's surface freshwater and each day it gives 40 million people their drinking water.
How we understand and govern bottled water in this region is critical.
This map should not exist. Information on water withdrawals is rarely integrated across political boundaries and is seldom aligned with watershed boundaries. We need to question how this patchwork of data, permits, and politics affects our bond with water.
This map was made to illustrate this patchwork and to remind Great Lakes commoners that bottled water data should be mapped as if place mattered.
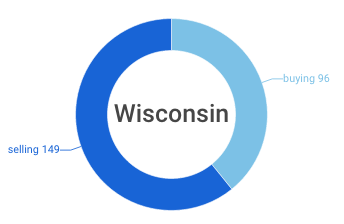
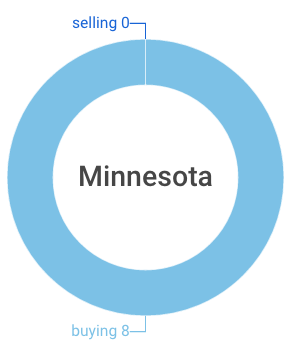
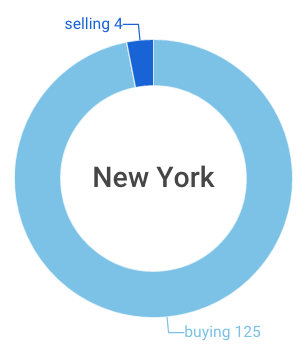
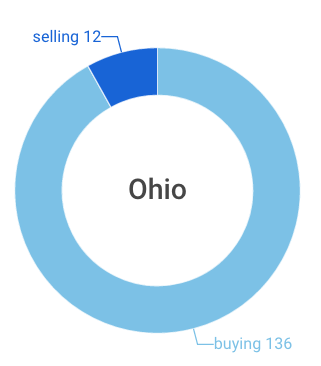
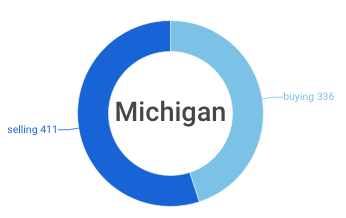
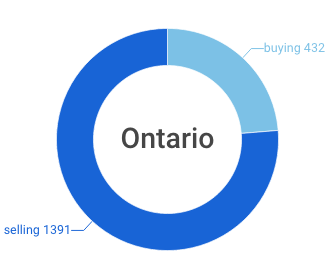
All map data is based on calculations within the Great Lakes watershed -- bottled water permits (selling category) and estimated bottled water consumption (buying category).
While bottled water is ubiquitous today (50 litres consumed by average Canadians and 34 gallons by Americans) the sources of this water remain mysterious. Do you check to see where your bottled water comes from?
Austerity stricken States and Provinces sell permits to wealthy bottled water corporations for pennies a bottle, while consumers pay 3,000 times more. Approximately 30% of bottled water is actually municipal tap water, but no government data is available. Meanwhile, tap water in many racialized and poor communities is too polluted to use with privatization and bottled water being the quick-fix solutions.
In 3 states (Pennsylvania, Indiana, Illinois) no water permits are sold. Great Lakes people in New York and Ohio are also grossly dependent on consuming water from outside their own boundaries. Minnesota has no permit data to share. Only Michigan, Ontario, and Wisconsin permit more bottled water than their residents in the Great Lakes consume.
The ethical, ecological, and financial hazards of bottled water are receiving more attention, but what new public education and advocacy does this map spur for the perpetual care of Great Lakes? How can we be great ancestors when our connection and calculations for water permits are so flawed?
To accommodate the homes and businesses of 3 million people in the Chicago area (9.5 million in the greater Chicago area), Illinois has special permission under the Great Lakes Compact to take water from Lake Michigan without replacing it to the Great Lakes. This water is transferred to the Mississippi River system instead.
With all the reporting about the recent water diversion decision for Waukesha Wisconsin, the debate over bottled water diversions is still missing.
Where does this leave us?
This map raises more questions than it answers.
- Where is the extra water from Michigan and Ontario going?
- Where is the bottled water for Illinois, Indiana, Ohio, Pennsylvania, and New York coming from?
- How can we find the data for bottled water coming from municipal sources?
- Which governing body should be collecting and analyzing this data?
- Why are watersheds managed like roads when they clearly flow across political jurisdictions?
What does this map make you think about? If you have access to more data to help us count better, please get in touch.
Download this map and special thanks to Caitlin Scopel and Crystalyn DelaCruz for their map making and research.